Introduction
Juggling multiple projects, chasing deadlines and progress, and keeping up with teams – a project manager has to walk a mile to get all these tasks done.
However, real-time visualization of the project management dashboard consolidates all the business data, making them readily accessible and understandable.
It’s like having your GPS, guiding you through the project management maze.
Also, guess what? A whopping 83% of project managers say that using project management dashboards is extremely essential to stay on top.
While creating a dashboard may seem overwhelming to you at this point. But, trust me, it’s easier than you think. With the right guidance, steps, and tools in your arsenal, you will be all set in no time.
I’ve shared some best ways to set up a project management dashboard to bring an end to your overwhelmness. And that’s not just that. There are benefits, examples, and practices to dive into too.
Let’s get into it right away.
What is a project management dashboard?
Project management dashboards are data-driven visual boards that act as quick reference points for project managers and teams. These innovative solutions gather all your scattered project-related information and key performance indicators in one central and convenient location. And it does all that using charts, metrics, stats, and insights.
These intuitive boards transform raw data into a format that is easier to understand. You can use them to uncover suspicious patterns, underperforming tasks, and potential roadblocks. This information then facilitates you in making data-driven decisions and taking corrective actions accordingly.
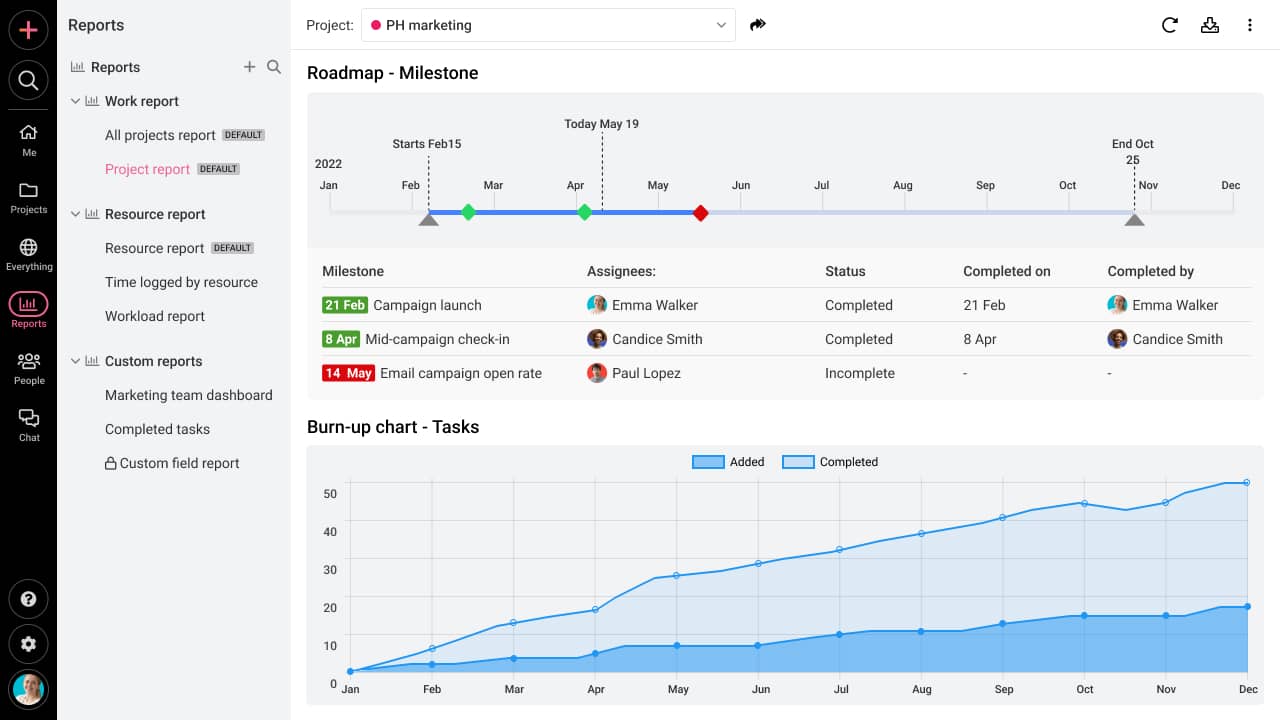
What is included in the project dashboard?
Some of the key data and metrics you may find in a project management dashboard are:
- Tasks with completion time: All the tasks with the estimated completion time
- Project status: An indicator of projects’ current state
- Milestones: These are stages or goals that need to be completed within a specific timeframe
- Events: Important dates relevant to a project. For example, deadlines, meetings, etc.
- Timesheets: A record of time spent by team members on various tasks
- Project owners: Individuals responsible for managing and overseeing a project
- Task dependencies: Relationship between two tasks in a project
- Timelines: A visual representation of all your projects and deadlines
A high-quality project dashboard enhances visibility and transparency across your organization’s operations. It keeps you updated with real-time insights while facilitating collaboration among your team members.
Benefits of a project management dashboard
A project management dashboard offers great benefits. Explore for yourself, and find out what aspects of this dashboard you can see integrating into your business operations.
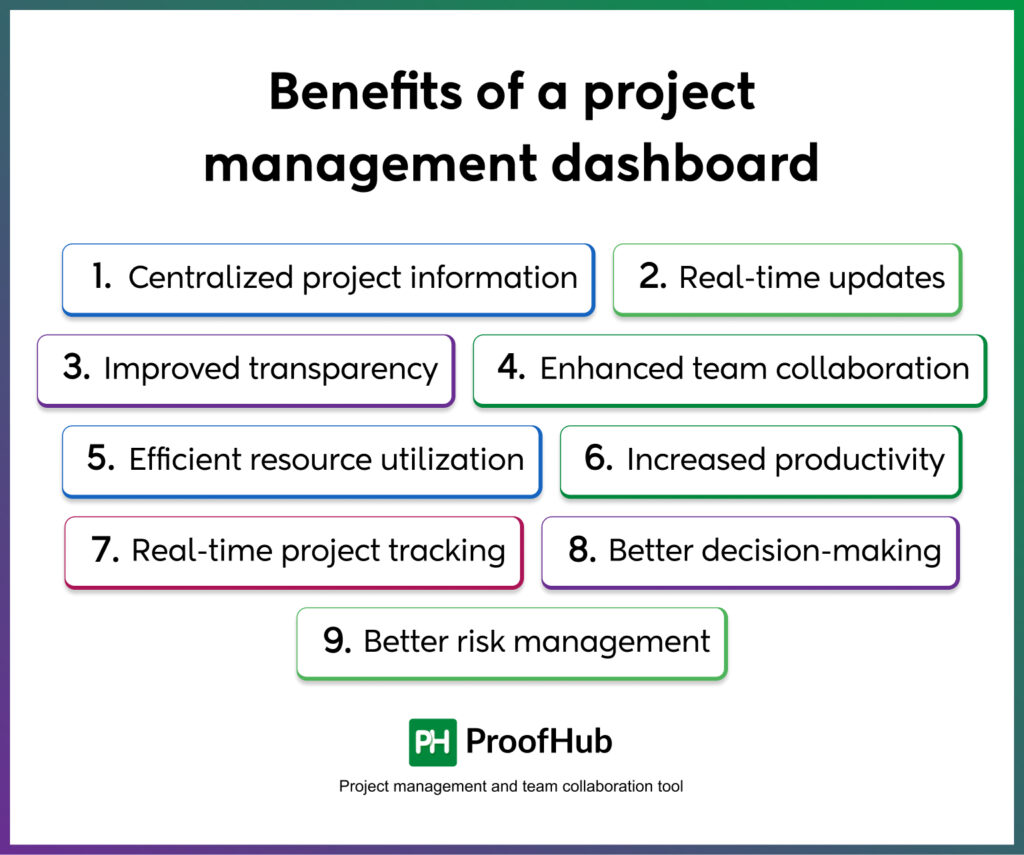
Some of the most prominent ones are:
1. Centralized project information
Project management dashboards back up project managers in their routine day-to-day operations by consolidating all the project aspects in one centralized view.
According to a survey conducted by TechTarget’s Enterprise Strategy Group, only 4% of organizations get real-time data insights. This even further emphasizes the need for utilizing these at-a-glance dashboards.
As they cut down on their efforts to sift through voluminous data sets. And act as a single source of truth for everyone.
2. Real-time updates and notifications
One thing that using centralized dashboards helps project managers is that they ensure their up-to-date nature. Which is contrary to traditional methods that take hours to maintain the data repository.
This ensures everyone has access to the latest project data and can act upon them with precision. Also, it removes the need to conduct manual updates and notifications. Instead, everyone gets a quick update on every functional and moving aspect of the activity without delving deep.
3. Improved transparency
A centralized view of project data on dashboards enhances transparency and visibility into the project lifecycle. This means both teams and managers can monitor any project aspect, like progress, status, and more, along with the discrepancies in real-time.
With this centralized data, everyone is informed and on the same page. Also, it allows you to navigate every individual effort toward achieving shared company goals.
4. Enhanced team collaboration
There are several collaboration features like status updates, notifications, messaging, comments, and file sharing available on a centralized dashboard. These features promote effective communication and coordination among team members and stakeholders.
By working together, pooling our resources, and building on our strengths, we can accomplish great things. — Ronald Reagan
With consolidated data on a dashboard, everyone has a clear understanding of project objectives, strategies, and scope. Nobody is left guessing, leaving no room for confusion. You can even use a dashboard to present compelling ideas and evidence in your meetings.
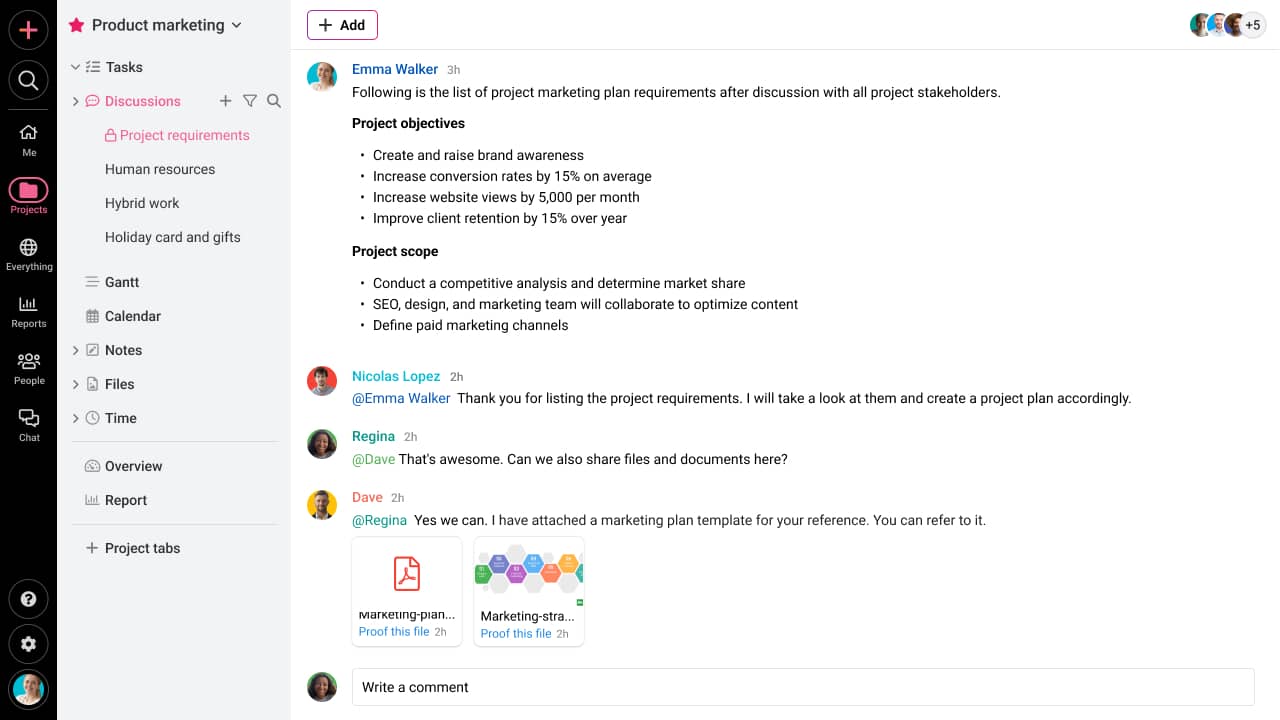
Loop in team members and keep every piece of information organized
5. Efficient resource utilization and allocation
At-a-glance dashboards allow you to keep track of how your resources are embedded in a project. Are they overly stretched to the limit of being overwhelmed, or are they hardly contributing to the project’s success?
With such a comprehensive view, you can optimize your resource allocation by ensuring fair work distribution. Because only then you can invest their efforts into areas with substantial scope of return.
6. Increased productivity and efficiency
Project management dashboards save project managers the unnecessary expenditure of resource efforts and hours. By providing a snapshot of data, you and your team don’t have to waste time on email checking and context switching.
Productivity isn’t about being a workhorse. Keeping busy or burning the midnight oil… It’s more about priorities, planning, and fiercely protecting your time. – Gary Keller
Instead, it automatically manages factors like sending updates, analyzing data, and prioritizing, which otherwise would have cost managers productive hours. Instead, they can focus more on core tasks that matter.
7. Real-time project tracking
A project manager has to always be on his toes regarding project progress. Dashboards ease their load by assisting them in real-time project monitoring. It gives them an edge over unexpected delays and enhances their chances of nailing the project.
They can utilize the information to be realistic, proactive, and agile in their approach. This improvised project management plan can enhance their effectiveness standards to improve team performance, prevent cost overruns, and get more done in less time.
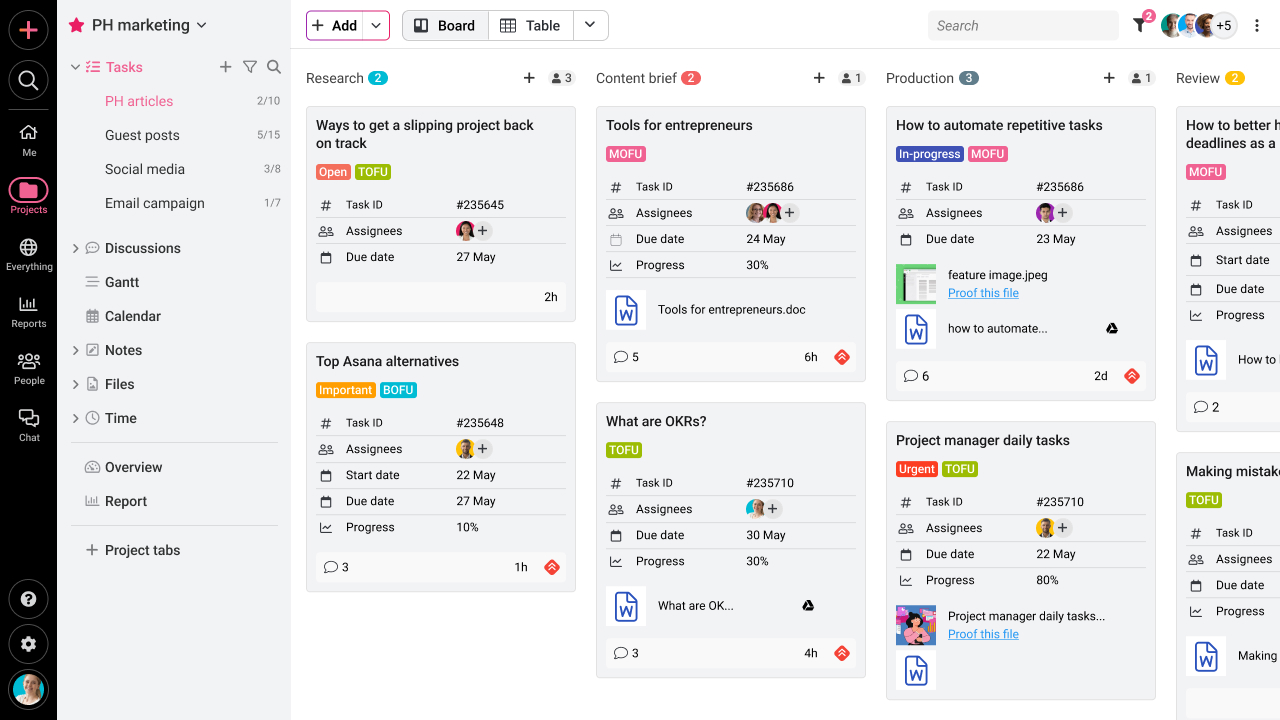
8. Better decision-making
By centralizing data, project managers can steal a swift glimpse into key project metrics and make decisions accordingly. They do not sit for hours looking into pre-project data and past events to get to a conclusion.
Also, analyzing current data becomes remarkably easy, resulting in effective refinements and optimized strategies. The results found out from the survey support the claim and are pretty compelling. It states that 88% of organizations agreed that having a single source of truth facilitates strategic decision-making and collaboration.
9. Better risk management and mitigation
Dashboards aren’t just data storage units. They detect patterns and send early alerts for potential risks and issues. Project managers can capitalize on these capabilities to prevent costly mistakes.
They can use these insights in their strategy to prepare their team for mitigating any potential discrepancies before any damage occurs. These also highlight the specific areas that may be falling behind due to lack of attention.
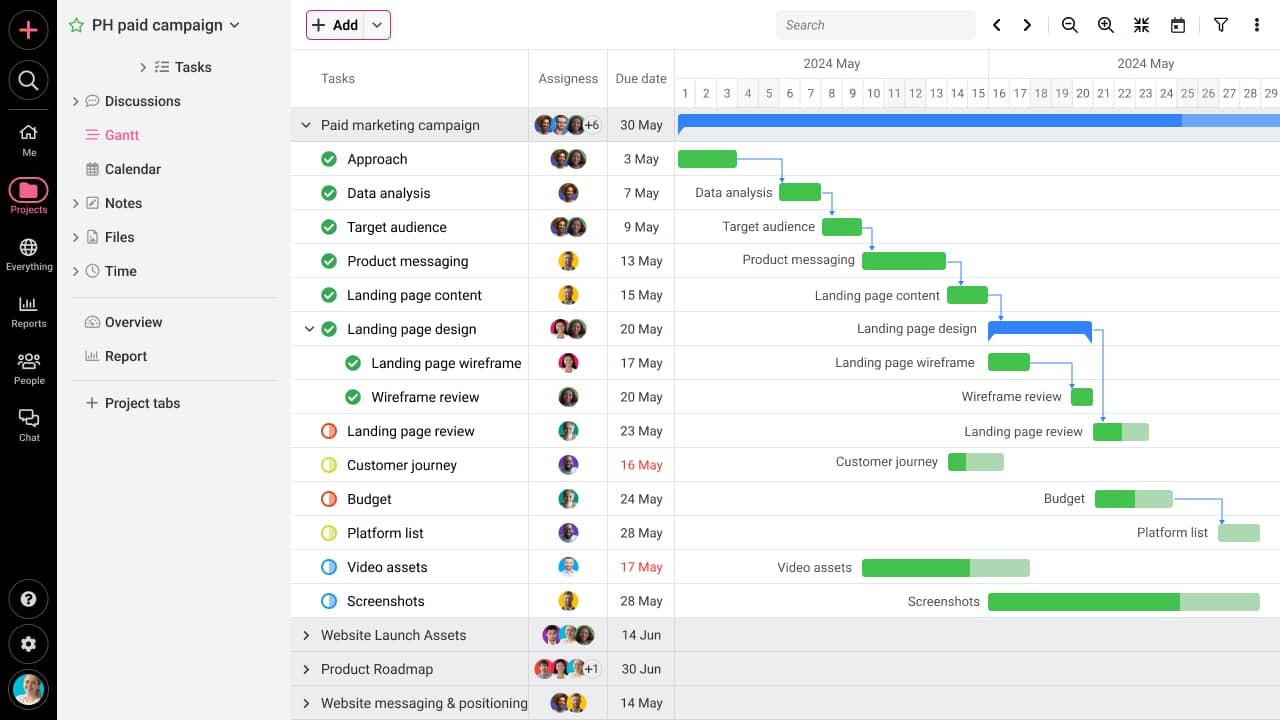
Take control of risks with powerful dashboard insights using the top 11 risk management software solutions
How to set up a project management dashboard
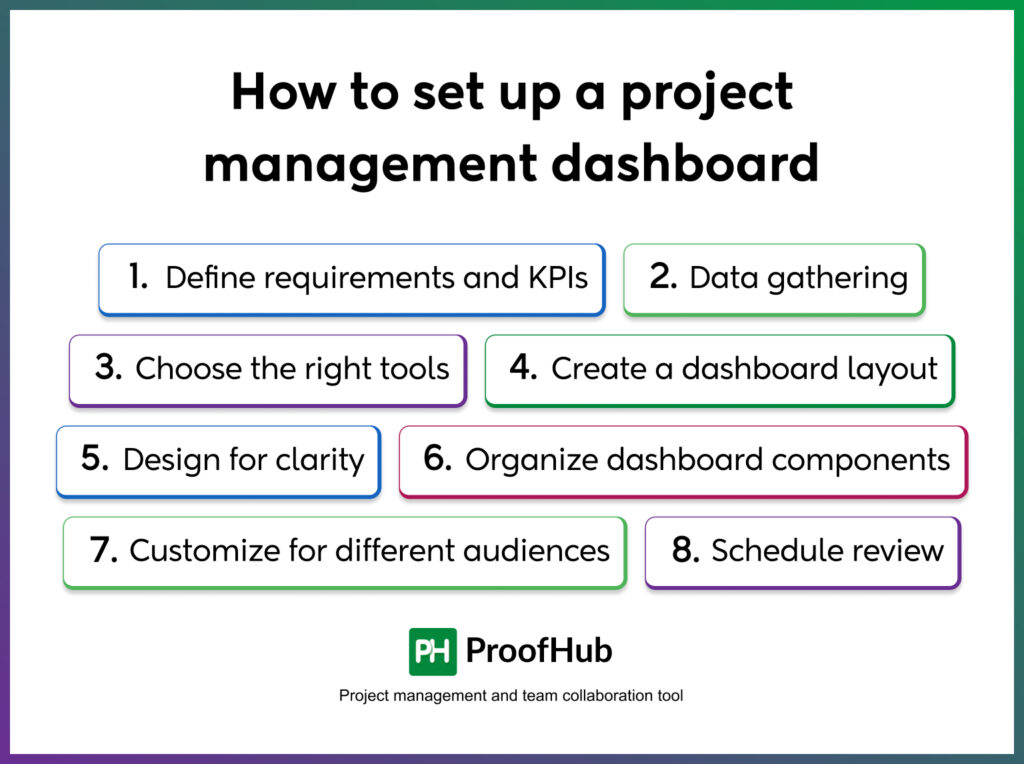
Building up your project management dashboard for data and information visualization isn’t a tough row to hoe. It instead depends on which application software you decide to go with.
The project management software provides you with the utmost flexibility to design your dashboard. However, here are some simpler things you should focus on before tailoring to your specific needs.
1. Define requirements and KPIs
Before setting up a dashboard of your project portfolio, understand what you need to get out of your dashboard. What is the main objective you want to achieve? What are the key parameters that will measure success? Once done, you can directly focus on building a dashboard of your success.
Some of the indicators you can use for your dashboard are:
- Team size
- Task status
- Team workload
- Resource allocation
- Task deadlines
- Project type
- Project progress
- Team productivity metrics
- Stakeholder requirements
After that, deciding on how you want the data to be displayed will determine the usability of the dashboard.
2. Data gathering
Once you have a clear understanding of your objectives, the next thing to do is to gather all your data. Yes, you should collect every piece of information lying around in files, spreadsheets, communication channels, time-tracking software, or any other app. Doing this will ensure your dashboard’s credibility and accuracy. And you can utilize the information for data analysis, decision-making, and performance monitoring.
3. Choose the right tools
With so many project management platforms available in the market, choosing a customizable solution like ProofHub is crucial as moving forward. Even though some tools offer built-in dashboards, make sure to evaluate the tools’ capability of allowing you to tailor the visualization and layout to your needs. Look out for comprehensive solutions that also centralize your routine operations while enhancing visibility through dashboards.
Explore the top project management tools with comprehensive project management dashboards
4. Create a dashboard layout
This is where the most crucial part lies – designing your dashboard’s layout. Decide the approach you want to take to organize your data on the dashboard. Make sure to highlight the metrics that need more emphasis. You can leverage various visualization parameters for your dashboard.
- Charts
- Graphs
- Tables
- Maps
- Data grids
- Progress bars
- Heatmaps
5. Design for clarity
Once you are done selecting the relevant parameters, it’s time to move one step ahead. You should focus on enhancing the clarity and building an uncluttered layout. It shouldn’t just appeal visually but should make things simpler and easier to understand. Your team members and stakeholders shouldn’t have to struggle to interpret the information.
6. Organize dashboard components
Here comes the most important aspect of building a project dashboard. You need to structure and arrange individual elements within the dashboard layout to form a coherent pattern. Why? Because your audience should be able to better read and scan briefly. For better comprehension, you can even rearrange the parameters. For example, in the top-left corner, you can place the most crucial metric for immediate visibility.
7. Customize for different audiences
Understand the fact that not every stakeholder will have the same preferences and needs. And to cater to everyone’s requirement, you math have to make modifications then and now. You can do that in two ways – creating separate dashboards or permitting users to personalize their experience using filtering and sorting.
8. Schedule review
Lastly, schedule periodic reviews to capture new insights and identify the areas for improvement. Make the adjustments accordingly to maintain the efficiency, usefulness, and effectiveness standards. Also, you can gather feedback from all individuals concerned, and reflect them in your dashboard.
What is the difference between a good and a bad dashboard?
Business information is presented on dashboards to gauge high-quality performance. But is it that simple?
Because, in reality, not all dashboards stand the test of effectiveness.
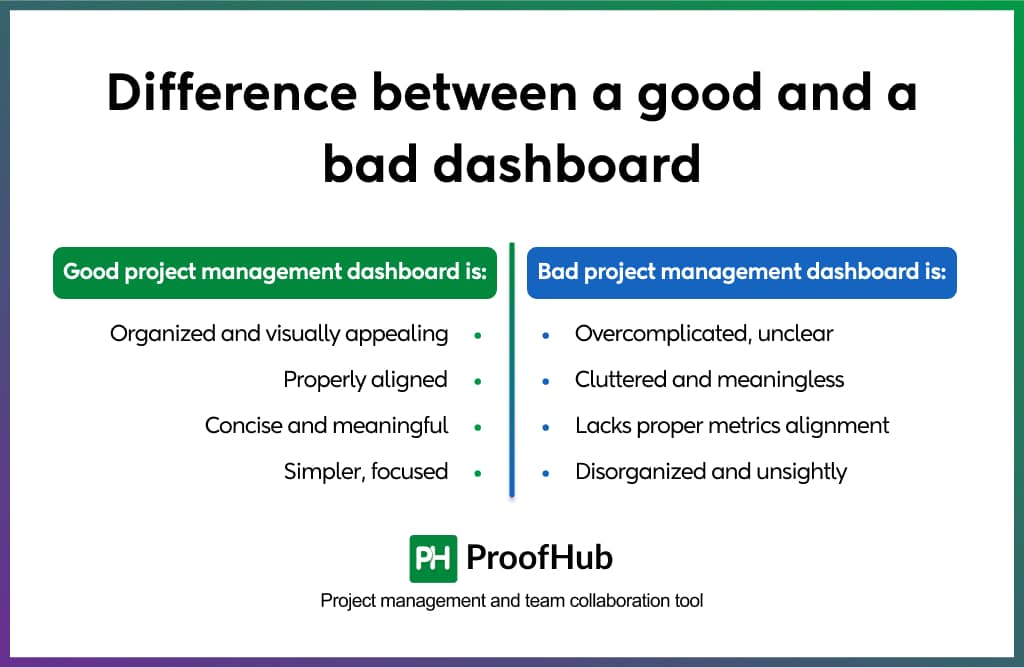
Let’s figure out what are the key differences between a good and a bad dashboard:
Good project management dashboard is:
- Simpler, focused, and easy to understand
- Concise and meaningful
- Properly aligned with goals and objectives
- Organized and visually appealing
Bad project management dashboard is:
- Overcomplicated, unclear, and confusing
- Cluttered and meaningless
- Lacks proper metrics alignment
- Disorganized and unsightly
Top project management dashboard software solutions
A project management dashboard is a digital tool that consolidates all the crucial project information. A project manager can sweep a gaze at the board to manage various project aspects. That is, they do not need to sift through multiple documents or systems to analyze the situation and monitor the project’s health.
ProofHub is one such platform that brings all your project data under one roof. You can keep a close eye on all the ongoing activities and updates. With its customizable dashboards, you can:
- Track all your projects
With ProofHub’s comprehensive all-projects report dashboard, you can get a snapshot of your project information in one place.
- Stay on top of task completion
You can view the amount of work being done by your team members on each project within a selected deadline.
- Monitor your team members’ progress
Using resource reports, you can track your resources’ activity both in and out. This will help you analyze how productive they are and what tasks they are working on.
- Identify your team’s workload
With proofHub’s workload reports, you can visualize a resource’s stretch over the assigned tasks.
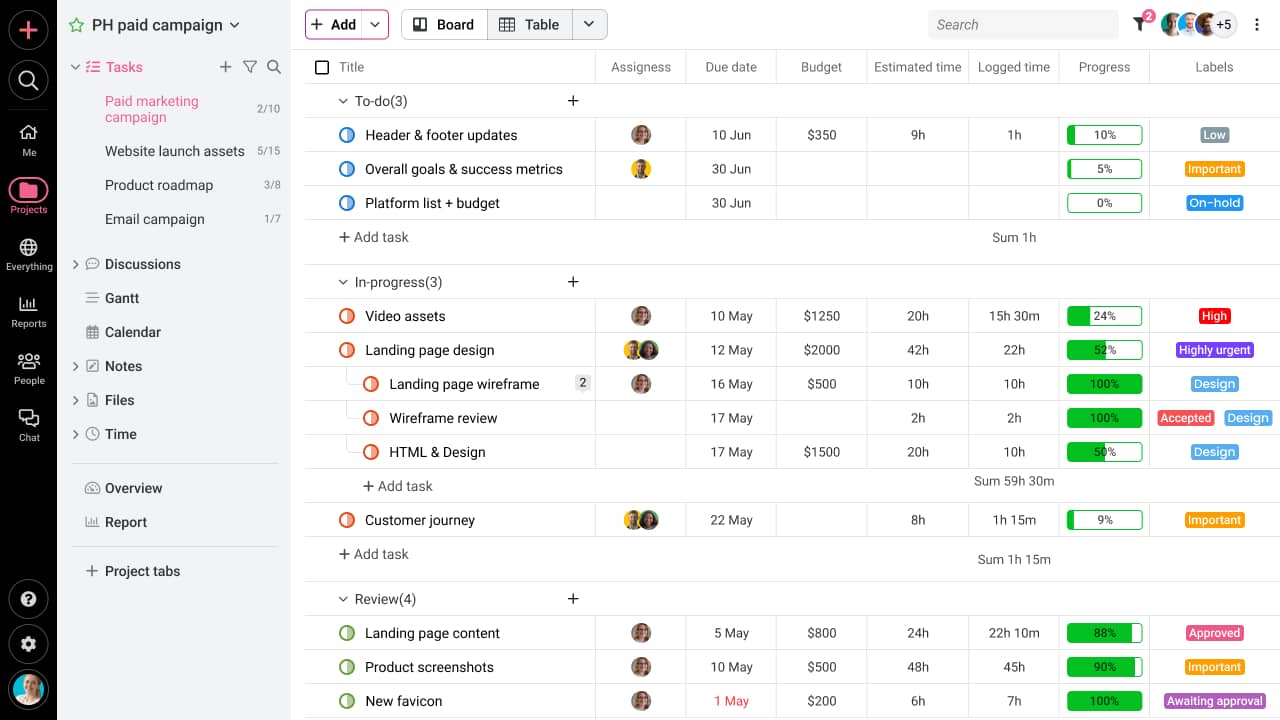
- Stay relevant with pertinent information
Get a brief overview of all your tasks, milestones, events, and upcoming deadlines in one place for a clear understanding.
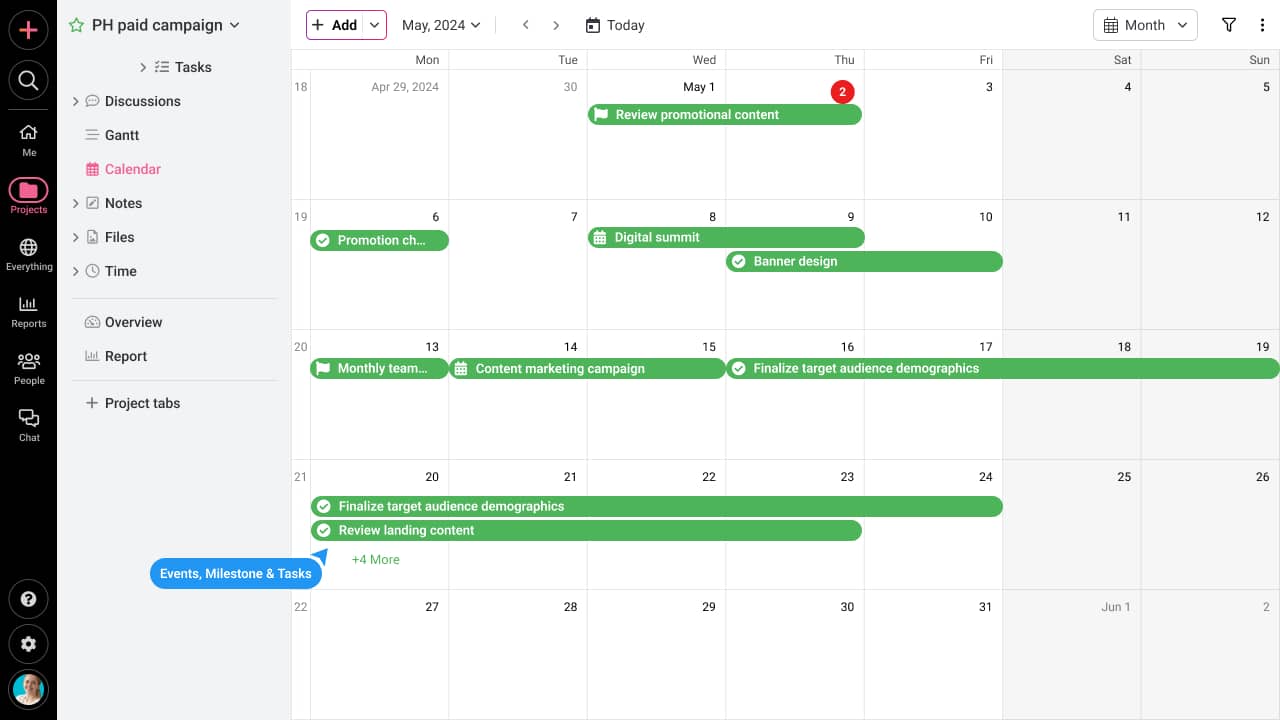
For choosing the right project management dashboard solution, make sure to evaluate your options based on the following key parameters:
- Ease of use: Creating a dashboard and navigating through it shouldn’t be a daunting struggle for anyone. It should be easy to understand and operate for all users.
- Customization: A feature you cannot compromise on is your dashboard’s ability to be customized. It is necessary to tailor it to align with your specific workflow and requirements.
- Collaboration: To keep everyone informed and on the same page, opt for an application that offers integrated chat, comments, and file-sharing capabilities to facilitate seamless collaboration among team members.
- Resource management: Resource management is an essential feature to look for to ensure optimal resource utilization and allocation, ultimately contributing to productivity and efficiency within the organization.
- Task tracking: To keep projects on track and monitor progress effectively, consider looking for a solution that offers robust task-tracking functionalities. Because it will help you spot bottlenecks in time and address them promptly for smoother project execution.
- Reporting: A project management dashboard software should offer robust reporting software to help you uncover hidden patterns, discover data-driven insights, and make informed decisions based on real-time data analysis.
- Pricing: Pricing is a major consideration that can impact your budget significantly. Look for a solution that offers transparent, flat-fee pricing structures and doesn’t inflate costs with increasing user counts or additional features.
Explore ProofHub’s flat-fee pricing solutions to cut down unreasonable expenses on every user onboarding
Project management dashboard examples
The best project management dashboard is comprehensive and aligns with specific needs and objectives. Both my team and I have used project management dashboards in our marketing ventures to enhance project performance and team effectiveness. And the results have been remarkable.
Here are three dashboard examples that are integrated parts of our business operations:
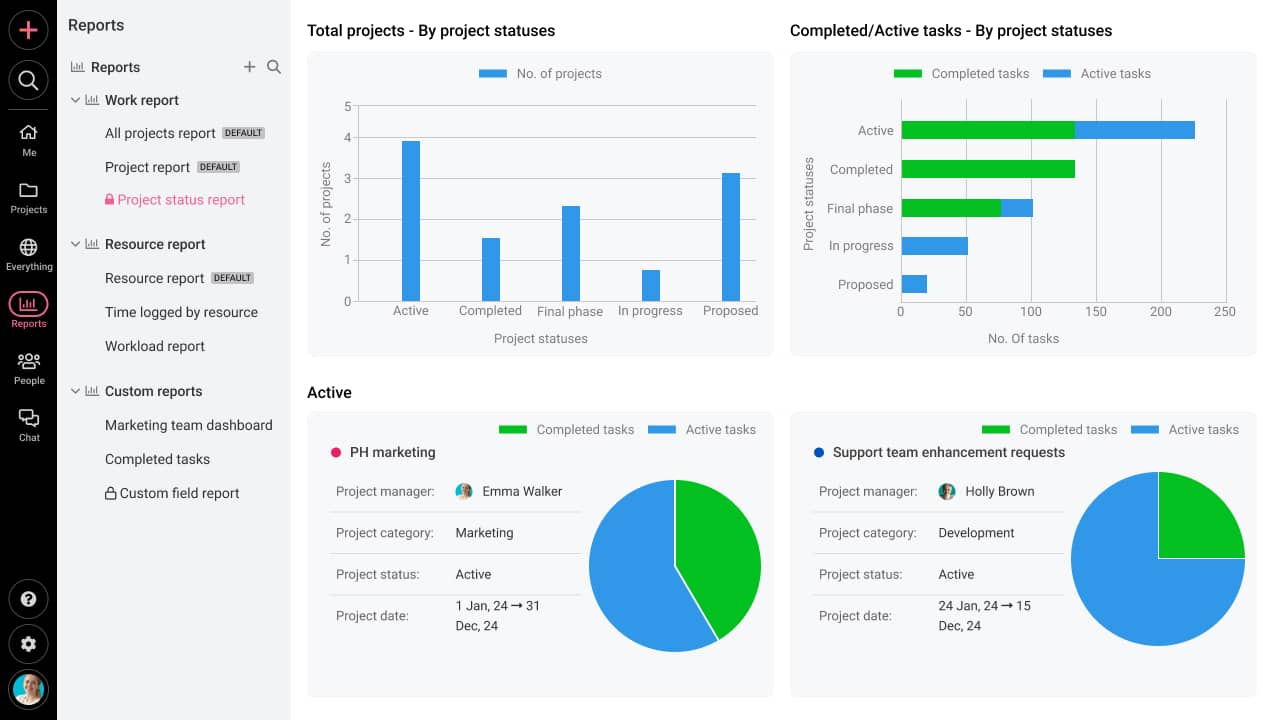
1. Project status dashboard
A project status dashboard is a dynamic tool that keeps you updated on different project aspects. It showcases various performance indicators and allows you to track projects with ease. You can visually represent data using Gantt charts, pie charts, and progress bars to gain insights.
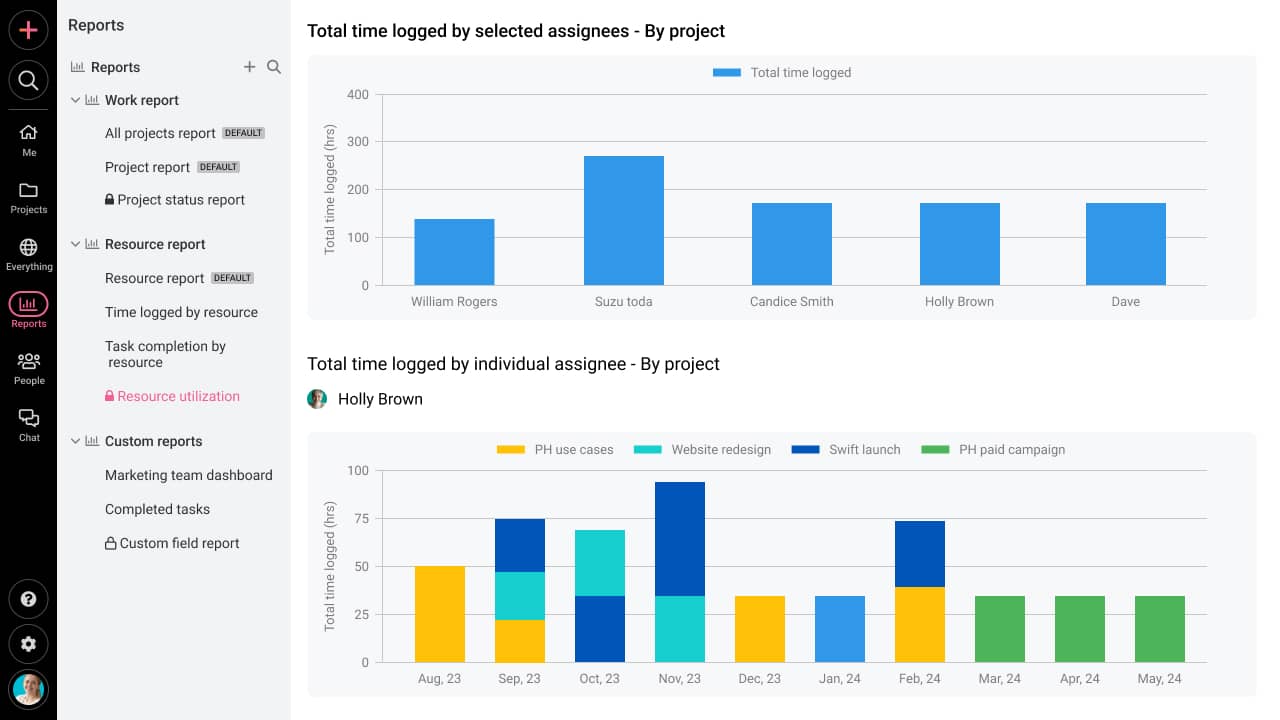
2. Resource utilization dashboard
With a resource utilization dashboard, you can gain insights into how much effort your team is investing in various projects. You can leverage this data to refine and optimize your resource allocation for maximizing resource utilization.
3. Team performance dashboard
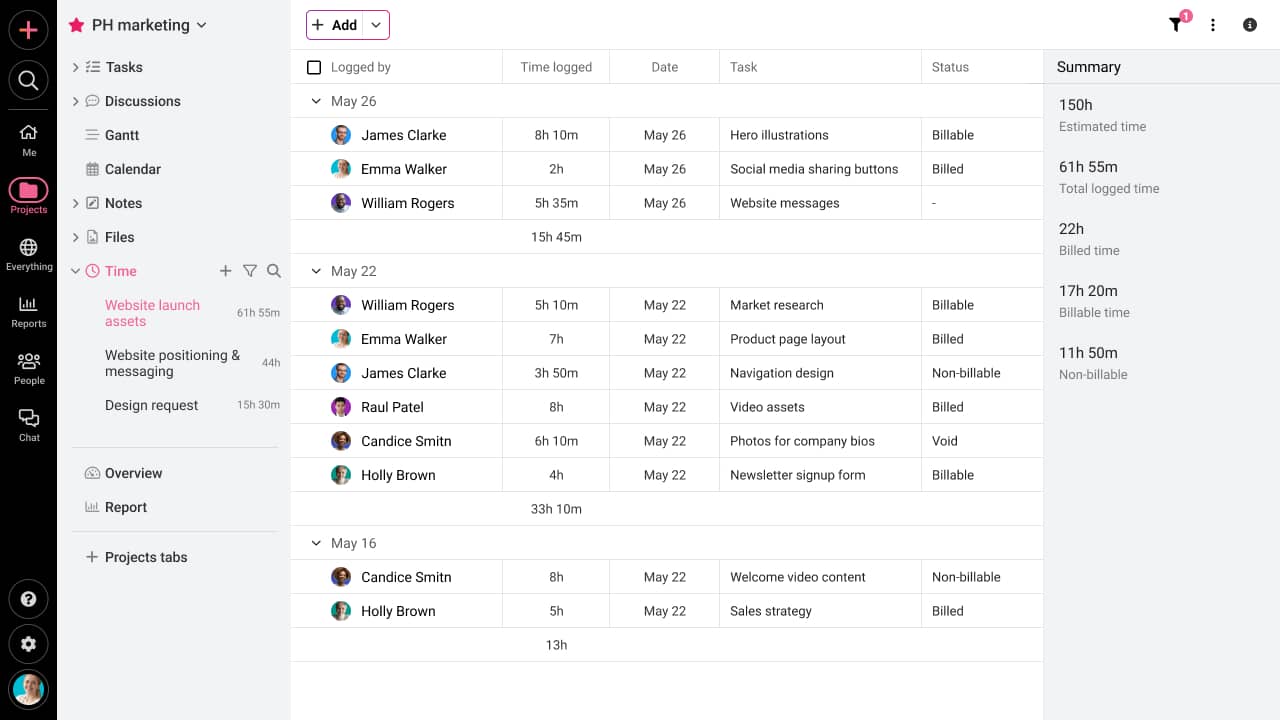
Consider the team performance dashboard as a timesheet, where you can get a complete overview of the time spent by your team on tasks.
Enhance your teams’ performance standards using the 11 best performance management tools
Best practices for designing project management dashboards
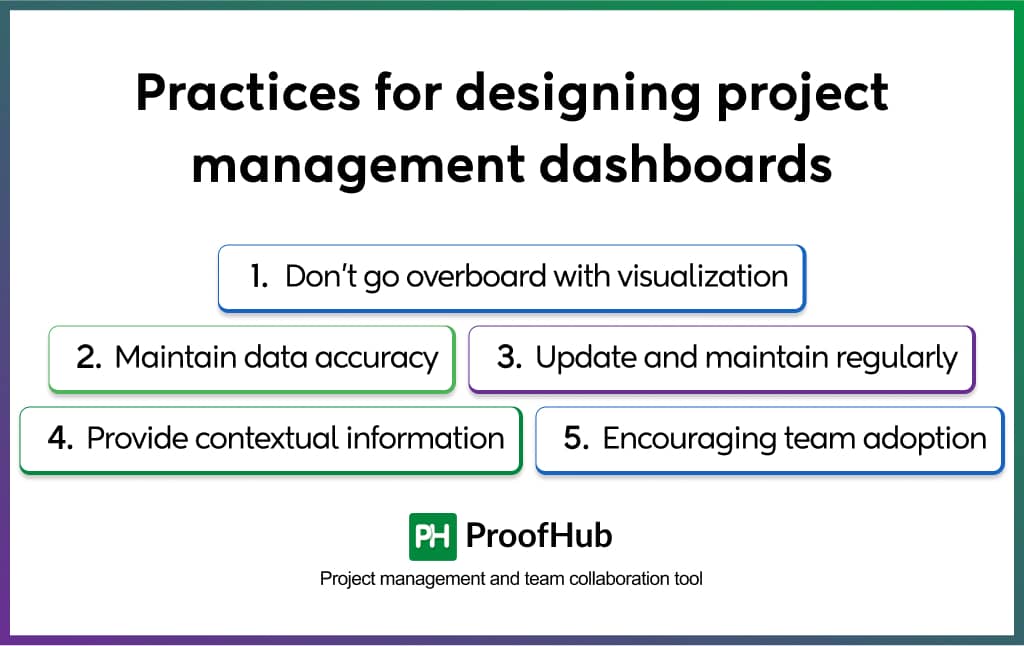
Regardless of the key metrics you want to include in your dashboard, here are some tips you can consider for enhanced data efficiency:
1. Don’t go overboard with visualization
Visuals enhance the user experience by simplifying the information complexity. Tools like Gantt charts, pie charts, bar graphs, and tables convey the insights more effectively which otherwise would get lost in texts and long data lists. But don’t go extravagant with visualizations. Instead, be mindful of what parameters will better be communicated when presented visually.
2. Maintain data accuracy
Data is the backbone of any project. And keeping it up-to-date when creating a project dashboard is mandatory. As it will ensure the reliability of your dashboard which anyone can utilize for making real-time, informed decisions.
3. Update and maintain regularly
Another factor that can ensure the dashboard’s credibility is its regular update and maintenance. To do so, you should be considerate towards user and project feedback, unusual patterns, and changing requirements to ensure its effectiveness over time. That can be done by incorporating new metrics and refining visualization techniques for better clarity.
4. Provide contextual information
Your dashboard design should be intuitive in itself. But you may come across a situation where you will have to provide context for the data. To address this, stay open to inquiries and questions from team members and stakeholders. Educate them about the dashboard aspects whenever required, ensuring they have a clear understanding of the data and its implications.
5. Encouraging team adoption
While some team members may feel hesitant about the approach, educating them about the dashboard’s significance is crucial. Encourage them to utilize the dashboard as a central tool for their daily operations. You can do that by providing support and guidance, hosting training sessions, and demonstrating the benefits firsthand.
Ready to take control with powerful dashboards?
It is fair to say that project management dashboards are project managers’ allies. These project management tools eliminate manual hassles to replace them with workflow efficiency and productivity. These save managers the time, effort, and resources to complete every project successfully.
ProofHub has made its mark in this field by offering a customizable approach to data visualization. Its user-friendly dashboards are easy to interpret and navigate. These can handle many projects while catering to the needs of teams of all sizes.
To see for yourself, you can experience the intuitiveness of ProofHub’s powerful dashboards by signing up for its free trial.
FAQs
What to put on a project management dashboard?
A project management dashboard is comprehensive. But that doesn’t mean you should overcrowd the space to add to the levels of unnecessary overwhelmness. Some prominent metrics you can include in your metrics are:
- Project description
- Deadlines
- Status indicator
- Project milestones
- Percentage completion
- Goals
And more.
What is the main purpose of the management dashboard?
The main purpose of the management dashboard is to centralize the crucial data and key performance indicators in a visual format. Managers, team members, and stakeholders can utilize the dashboard to streamline their operations in real-time to drive optimal efficiency.
How does a PM Dashboard contribute to project success?
A PM dashboard acts as a central information center for project managers. They can utilize the up-to-date information for their decision-making process, optimize resource allocations, track potential risks proactively, and more.
Why do most dashboards fail?
Several reasons result in dashboard failures:
- You created a dashboard without even understanding its purpose.
- Your dashboard is overly cluttered and is overwhelming to understand and utilize.
- You didn’t discuss dashboard aspects or take stakeholder feedback into account before creation. And it is irrelevant to user needs.
- Your dashboard is poorly designed and lacks effective visualization.
- Your dashboard is outdated and not maintained regularly to stay relevant in real-time.
