Introduction
A Gantt chart is a popular tool for managing projects. It shows the timeline of a project in a visual way. It helps teams coordinate tasks, manage dependencies, and meet deadlines effectively. They ensure efficient use of resources and help avoid delays.
Whether you are managing a small project or a complex project, Gantt chart software makes it easier to communicate and make changes along the way.
Gantt chart is a widely used tool, not just by project managers; people from all walks of life are now using it to plan, organize, and deliver. If you always wanted to learn what Gantt charts are and how you can benefit from them, you’ve come to the right place. Before jumping straightaway to its benefits, let’s first understand what they are.
What are Gantt charts?
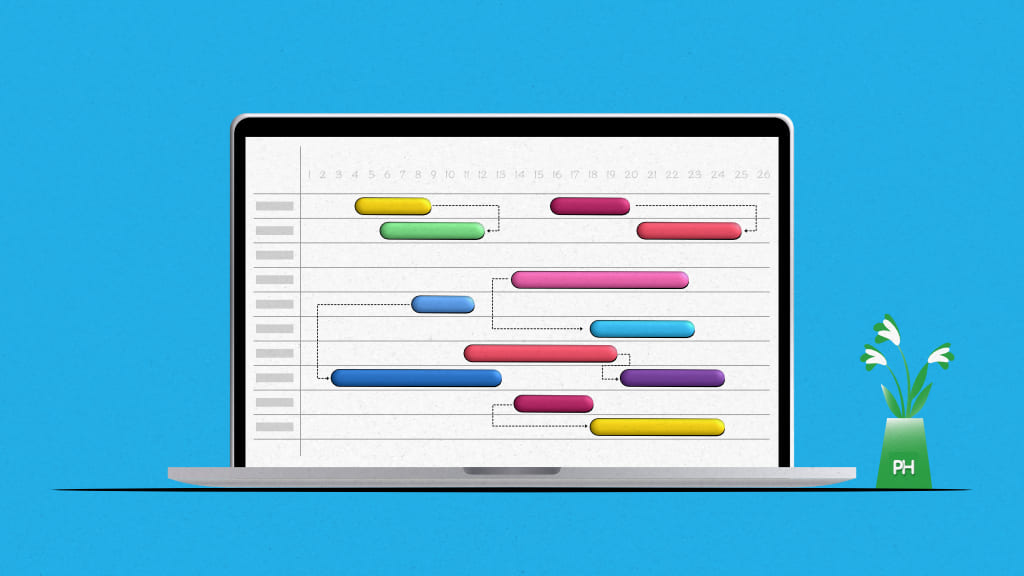
Gantt charts are a visual view of tasks displayed against time. They represent critical information such as who is assigned to what, the duration of tasks, and overlapping activities in a project.
The task is represented in a horizontal bar, where the length of the bar shows the task duration. Gantt charts show a clear view of tasks, showing when each task starts and ends, which tasks overlap, and their dependencies, like which task must be completed before starting the other task.
All in all, Gantt charts are the perfect allies for planning, scheduling, and managing a project.
What is the history of Gantt charts?
Gantt charts have an interesting history that needs to be shared. The origin of the tool dates back to the late 1800s when a Polish engineer Karol Adamiecki invented a diagram called harmonograph. The major reason behind inventing this diagram was to improve the way production schedules were displayed during that point in time. The only problem was that all findings and other critical information were published in Polish and Russian only.
Meanwhile, Henry Laurence Gantt, a management consultant and an engineer, was also working on a similar concept around 1910. He designed a chart to help manufacturing managers to easily visualize their work schedule. With time, it underwent some changes and evolved into Gantt charts. Therefore Henry Gantt is considered the inventor of Gantt Chart (hence the name).
Since we have revisited what Gantt charts are and how they got popularized, it’s time that we discuss how online Gantt charts make project management better.
Why are Gantt charts used?
A Gantt chart is like a road map for projects. If you are wondering what the Gantt chart is used for and why it is useful, you need to know that it simplifies the planning process. In its simplest form, a Gantt chart is a timeline that illustrates how the project will progress during the project management process.
The timeline view offered by the Gantt Chart app has proven quite useful for planning and scheduling projects. It helps project managers and teams assess how long a project should take, determine the resources needed, understand the dependencies between tasks, and plan the order in which each task will be completed if the whole project is to be delivered on time.
Here are some reasons why Gantt charts are used:
- Keeps everyone on the same page: A Gantt chart provides a clear overview of the project timeline. It shows the current position, destination, and the time it will take to complete.
- Makes complex projects less overwhelming: A Gantt chart breaks projects into manageable tasks and helps to reduce the “where do we even start?” feeling. So everyone can see each task and its deadlines clearly.
- Shows how tasks are connected: A Gantt chart clearly shows how tasks depend on one another. If there is a delay in one project, the Gantt chart shows how it affects everything else and helps you to adjust if needed.
- Tracks progress in real-time: A Gantt chart helps to track what is done and what is left. It gives our team a sense of achievement as we move forward.
- Helps with balancing workloads: A Gantt chart can highlight how many tasks everyone in the team has. It makes it easier to distribute tasks more evenly and prevent burnout.
- Boosts communication and collaboration: The Gantt chart shows everyone what’s happening and makes it easier to keep everyone aligned without the need for endless back-and-forth emails or meetings.
- Keeps deadlines in sight: A Gantt chart clearly shows us the timeline so that you won’t lose track of the deadlines. It gives you a reminder of when things need to be done and reduces the risk of last minute rush.
What are the benefits of Gantt charts?
There are several benefits of Gantt Charts, making them a popular tool in project management. The most important benefits of Gantt charts are:
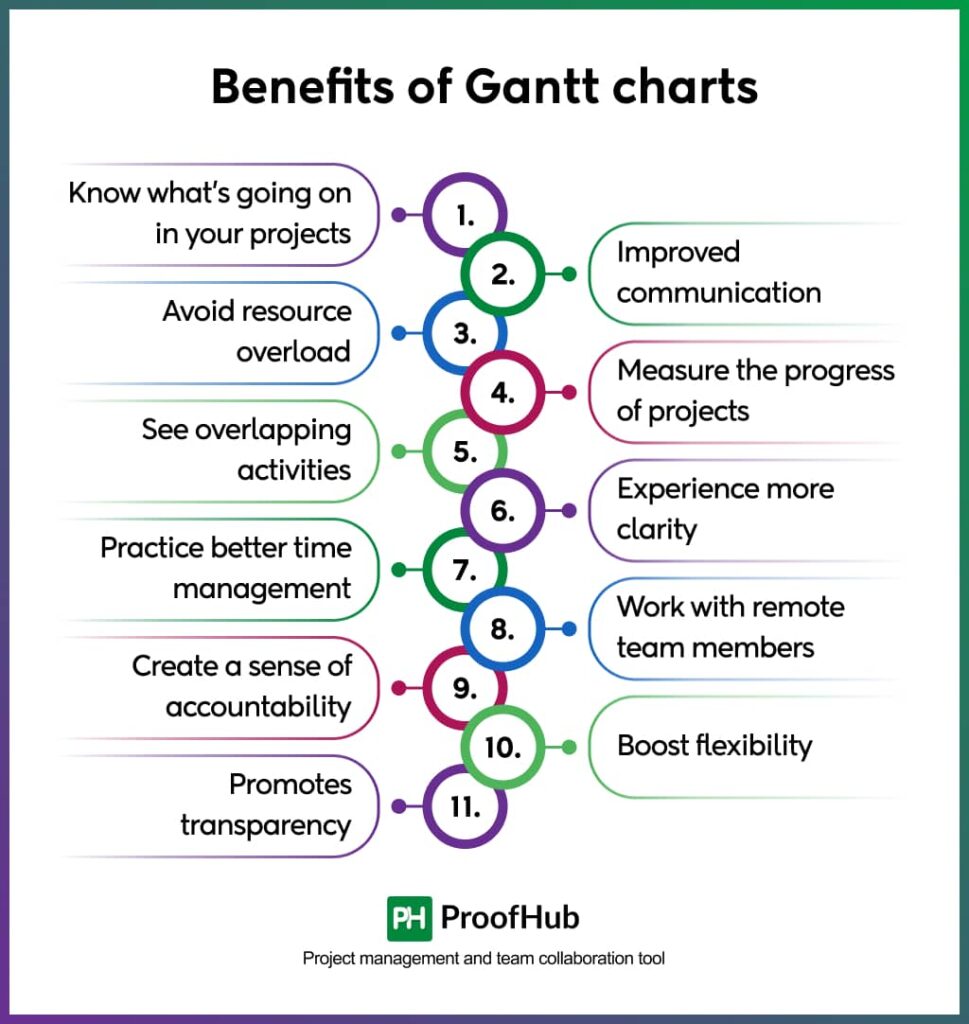
1. Know what’s going on in your projects
The biggest advantage of Gantt charts in project management is seeing everything related to the project in a single place. It acts as a great visualization and prioritization tool as it provides the total overview of the project and tells you about the critical information such as members involved in each step, the order of tasks, duration, start-to-end dates, task dependencies, and progress made in projects. Hence, online Gantt charts software helps equip project managers with the information they need to oversee while managing projects.
2. Improved communication and team cohesion
Communication is an integral part of a project that can make or break it. 86% of employees feel lack of communication is the biggest reason for workplace failures. On the other hand, Gantt charts are known to provide crystal-clear communication. Project managers can use these charts to see who is working on which tasks, provide input on certain tasks, and communicate relevant information to the team members. This helps managers to communicate better with team members and also improves their relationship as a team. Most importantly, it eliminates the need for a separate tool for tracking and communication purposes.
3. Avoid resource overload
Too many problems arise when resources are stretched over tasks and processes. Gantt charts allow you to use your resources effectively as you get to see a project’s timeline where you can easily see how and where resources are being utilized. Within Gantt charts, you can also delegate tasks and align resources without burdening them with too much work. This way you can effectively manage resources and when resources are properly managed, projects are more likely to be completed within budget and deadlines.
4. Measure the progress of projects
Once you schedule your project in a Gantt chart software you can check the progress of the projects. The feature to measure a project’s progress enables you to change your strategy if it lags behind its schedule. As project members can update the completed percentage of each task, everyone stays on the same page. This information is useful to determine if the project is headed in the right direction.
5. See overlapping activities and task dependencies
At times, you cannot start a certain task unless another task which is dependent on the former is completed. Such task dependencies can make things difficult to manage, especially when the project is complex or it has too many tasks. As you get to see an overview of projects in a Gantt chart software, you can easily see which tasks are dependent on each other and schedule them in a way that they don’t impact the overall progress in any way and team members share equal responsibility.
6. Experience more clarity
It’s not a good feeling when you get stuck in a project and don’t know where things are going. Although it’s quite common to get stuck while working on a project, however, Gantt charts let you see things with a lot more clarity with just a click. As you can instantly see the progress of tasks, it helps you and others working on a project to develop a better understanding of how things are unfolding. More clarity means better understanding which further leads to successful completion of a project.
7. Practice better time management
Many project managers pitch scheduling as one of the biggest benefits of Gantt charts in project management. As time plays an important role in a project lifecycle, Gantt chart software helps project members understand the severity of time delays while managing projects. It’s easy to get carried away and work mindlessly on tasks but when you have a unified view of the overall progress, you can easily allocate time to every task and do what needs to be done.
8. Work with remote team members and motivate them
According to a recent study, almost 75% of American employees would prefer to quit their jobs and change it for a remote position. Remote work is quite popular these days. It’s one of the trends expected to dominate the world of project management in the coming years.
However, working with a remote team has its challenges. When you manage a project with a remote team, you have more difficulties coordinating and keeping everyone in the loop. A Gantt chart, being an effective solution for modern teams, makes it easier for everyone to stay on the same page while working together.
Gantt chart is certainly one of the best ways to work with remote teams and keep them motivated. It allows you to visualize what’s already done, what’s in progress, and what lies ahead, keeping everyone shoulder to shoulder during the project development regardless of the country they’re in.
9. Create a sense of accountability
Using Gantt charts during project management allows both project managers and teams to track team progress, highlighting big wins (like a task completed on time and a milestone achieved ahead of the schedule), as well as major failures.
This functionality of the Gantt chart helps to create a sense of accountability in the workplace. It gives both managers and team members a fair opportunity to leverage this solution to highlight how frequently they exceed expectations and get recognition in the workplace.
10. Boost flexibility
Change is a crucial part of the project management process. Even if your project plan appears to be foolproof, you and your team need to be prepared for the possibility that you might have to adjust your expectations as per the changing situations.
Having a user-friendly Gantt chart tool can help you relieve yourself from potential headaches in such conditions. You can use a Gantt chart to help your team keep moving towards reaching the desired goal and milestones, while still being flexible in how to get there. Besides that, you can also employ Gantt chart templates in your projects for your custom needs.
11. Promotes transparency
Transparency in the workplace promotes trust and teamwork amongst your team. Being aware of each other’s responsibilities in a project is an important part of that process. A Gantt chart is certainly helpful in this case. It shows the details of each team member’s tasks and milestones in one place so that everyone is aware of each other’s workload and helps those who may be struggling to fulfill their work. This kind of transparency in the work process further boosts teamwork, honesty, and humility within the team.
What are the limitations of Gantt charts?
Here are some limitations of Gantt charts:
- As the number of activities and dependencies rises, Gantt charts get more complicated and challenging to manage.
- It might be difficult and time-consuming to make major manual revisions to the chart when the project scope or deadline changes.
- Gantt charts can display task dependencies, but they might not accurately capture the complicated relationships that exist between multiple tasks.
- Gantt charts are mainly used for scheduling tasks; they are not very good at managing or tracking the allocation of resources, such as money, people, or equipment.
- In traditional Gantt charts, real-time updating feature is not available unless they are not integrated with project management software. So, if there are any changes in tasks, deadlines, or progress, they need to be manually updated, which can lead to inaccuracies or outdated information.
- Gantt charts can make it difficult for team members to work together in real-time because they are not flexible and difficult to update when changes are made in the project’s timeline and scope.
What the applications of Gantt charts?
The sheer simplicity and ease of access to all relevant information make Gantt charts an ideal choice for teams to use for organizing their schedules. Here are some important applications of Gantt charts:
Project Management: Gantt charts are used in many industries for planning, scheduling, and tracking tasks. They provide us with a visual presentation of activities and help project managers track progress and deadlines to ensure the completion of tasks on time.
Software development: In software industries, Gantt charts are used to plan, track, and manage dependencies of tasks to make sure that the coding, testing, deployment, and other stages of tasks are completed on time.
Marketing campaign management: Gantt charts are used by marketing teams to coordinate campaigns by scheduling tasks such as advertising, content creation, and social media posting so that all activities are completed in sync and within the campaign timeline.
Event planning: Gantt charts are used by event planners to schedule tasks like securing venues, coordinating with vendors, and sending invitations. This ensures smooth event execution by tracking deadlines and progress.
Research projects: Gantt charts are used by researchers to manage different phases of the project, from data collection to analysis and reporting. So researchers can track progress and ensure deadlines for submissions or publications are met.
What are the components of Gantt charts?
A Gantt chart has several components that help to visualize and organize a project’s timeline and tasks. These are:
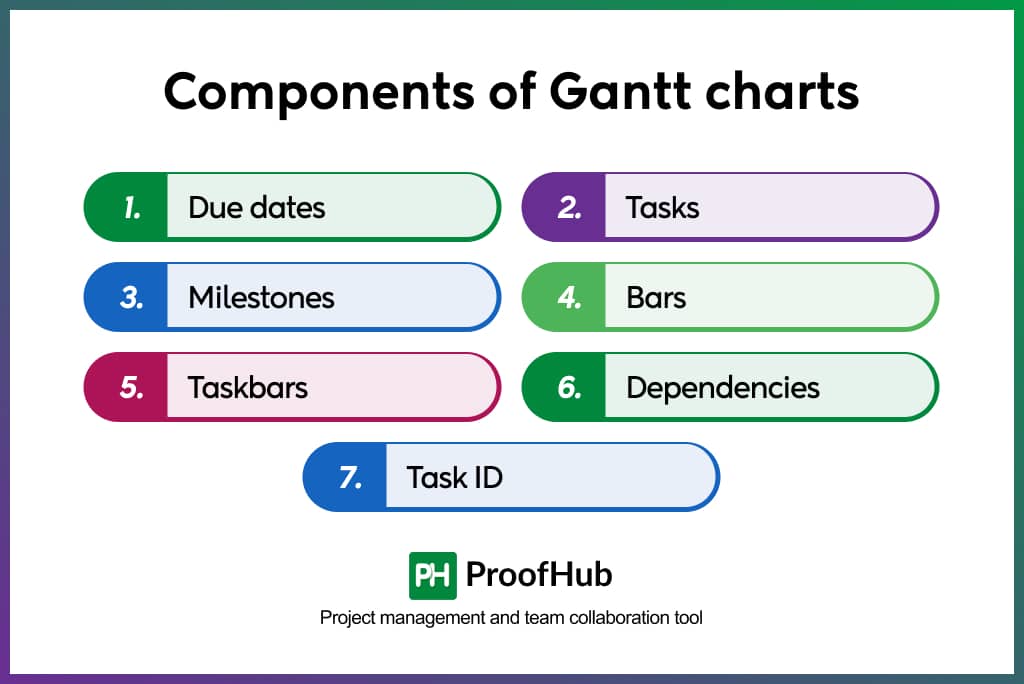
- Due dates: The dates are one of the most essential aspects of a Gantt chart since they show project managers when the project will start and end, and when each job will take place. These are shown at the top of the graph.
- Tasks: Major projects always seem to have a lot of sub-tasks. A Gantt chart assists project managers in keeping track of all sub-tasks in a project so that nothing is overlooked or delayed. The tasks are displayed on the left side of the page.
- Milestones: Milestones are tasks critical to a project’s completion and success. Unlike the minor things that must be completed, completing a milestone provides a sense of accomplishment and progress. After each block on a Gantt chart, milestones are represented by different shapes or icons.
- Bars: Bars are used to represent the time frame in which each task should be performed after the subtasks have been stated. This ensures that each sub-task is finished on time, ensuring the overall project is completed on time.
- Taskbars: While many sub-tasks can be accomplished pretty quickly, there will be occasions when you want to know how your project is progressing at a glance. The taskbars are shaded to represent the portion of each task performed previously, indicating progress.
- Dependencies: In a project, some tasks and subtasks depend on one another. For instance, a task must be completed before another can begin. On a Gantt chart, task dependencies represent this type of relationship. Small arrows between the taskbars are generally used to show these relationships.
- Task ID: You probably have numerous tasks simultaneously in today’s hyperwork world. The task ID is included on the Gantt chart to help everyone involved readily identify the task you’re discussing.
Tips for using Gantt charts
Here are some tips for using Gantt charts in your project management:
- Define project timeline: Users must determine how the project’s time will be divided into segments. Each one should specify a start date, a finish date, and/or a time estimate for completion. If you’re not utilizing an automated spreadsheet or Gantt chart tool, you’ll need to keep a calendar on hand. This will prevent you from scheduling work or deadlines on weekends or holidays by accident.
- Break the project down into manageable chunks: The project should be broken down into key components, then tasks and subtasks. Continue breaking things down until each one is a simple assignment. They should be short enough to allow for accurate estimation of timeframes. This can be done using a Gantt chart table with a hierarchical list of goals or work divisions, as well as tasks and subtasks listed beneath them. It can also be done visually with the use of a mind map. Many project planners feel that thinking and planning a project in this manner is significantly easier.
- Define a project path: Use lines to connect tasks that are dependent on one another to establish the critical path. Draw a line from the end of the first to the beginning of the second with an arrow pointing to the second to illustrate that it can begin after the first is completed.
- Add milestones: Milestones are significant events that either play a significant role in the process or must be achieved before further progress can be made. It’s a good idea to highlight items on your project to make it easier to see progress at a glance.
What are the best Gantt chart tools?
Before you start a quest for the best Gantt chart software for your team, take a look at these top-rated Gantt chart software:
1. ProofHub
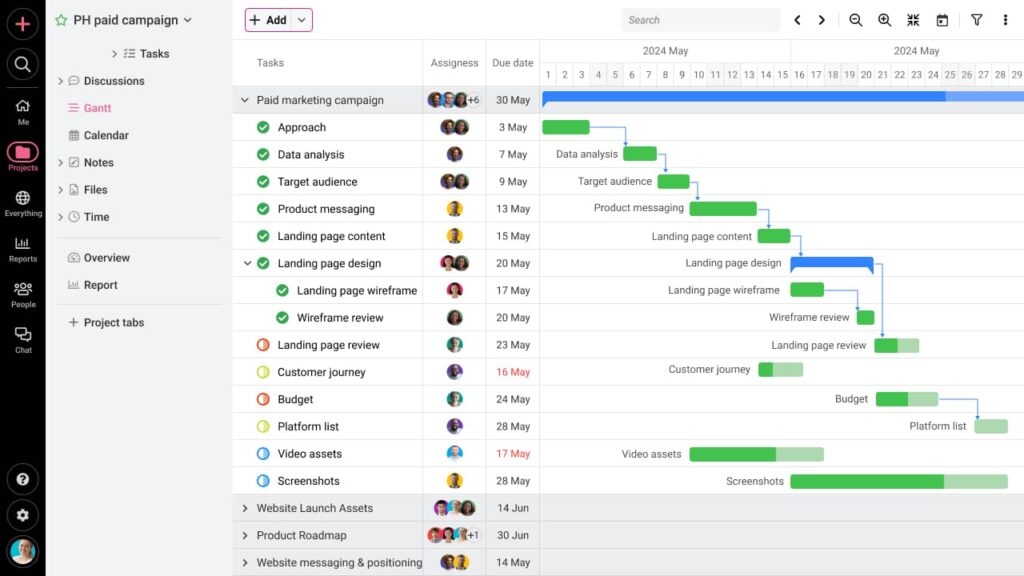
ProofHub is a feature-rich project management software with powerful Gantt charts that are easy to use. You can visualize all the tasks of a project in a timeline view that will give you a better idea of how projects are performing and if the project will be completed in the predetermined time.
By using ProofHub’s Gantt charts, you can set dependencies between tasks and highlight critical paths that will help you to ensure the timely delivery of a project.
Additionally, the drag-and-drop interface makes it extremely easy to modify task schedules as work changes and deadlines shift.
Here are some more highlights of Gantt charts offered by ProofHub:
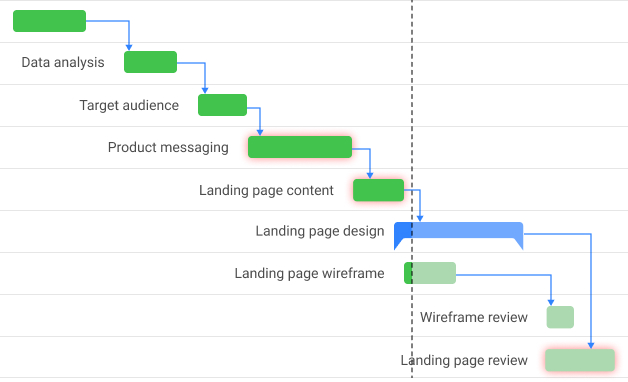
- Create new tasks and assign them to your team members
- Prioritize tasks and mark task progress in percentage
- Track the progress of each task as well as the progress of the overall project
- Create and associate milestones with tasks
- Manage which members of your team can access a Gantt chart
- Export Gantt charts to view them outside the software and also print to use them in meetings
Along with Gantt charts, there are many features in ProofHub that make it a comprehensive project management solution for teams of any size, any industry, and any department.
You can manage your tasks easily in the form of cards and even see how a task moves through different stages of the project workflow using Kanban boards. You have an online proofing tool to review and give feedback on files in real-time, and cloud storage to keep all your work files stored and organized in a single place.
Additionally, you can use timers to record time data, create custom project reports instantly, and even communicate with your colleagues using the built-in chat interface. To cut a long story short, ProofHub has almost every important tool integrated into it that you need to plan, collaborate, organize, and deliver projects.
Pricing: For information on our pricing plans, kindly visit our pricing page.
2. Celoxis

Celoxis allows you to create dynamic project plans and manage your projects using its built-in Gantt charts. You will get a graphical overview of the project schedule and keep track of the project’s progress.
It’s simple to get started with your project using Celoxis’s Gantt chart and you can easily create tasks, set start & finish dates, and define milestones. Visualize task dependencies and build dynamic project plans to ensure that the efforts of your team yield good results.
Pricing: The plan starts at $25 for managers (per month, billed annually) and $15 for team member (per month, billed annually).
3. GanttPRO

GanttPRO is another popular Gantt chart software that suits project management tasks effectively. It allows you to plan your projects and manage all the tasks on a Gantt chart. Moreover, the process of task delegation becomes easy and you can always stay updated about who is working on what task.
You can rely on this Gantt tool to prioritize tasks, set dependencies, and specify the duration of each task. Apart from managing tasks and visualizing timelines of projects, Celoxis also allows you to manage and make optimal use of your resources.
Pricing: The Basic plan starts at $7.99, Pro plan starts at $12.99 and Business plan starts at $19.99 per user per month.
4. Instagantt
Simple, intuitive, and powerful are the exact terms that define the Gantt charts offered by Instagantt. The drag-and-drop functionality of this tool makes it super easy to plot your project on a Gantt Chart and you need no prior training or technical knowledge.
There are a lot of features incorporated by Instagantt to its Gantt charts such as display task progress in percentage, highlight special events and milestones, and add custom colors for the bars. The tool also lets you export Gantt charts as images and Excel spreadsheets.
Pricing: The Individual plan is available for $12 per month and Team Plan is available for $24 per month (3 collaborators included).
5. Tom’s Planner

Tom’s Planner is a project management Gantt chart maker that you can use to create professional and visually appealing Gantt charts in a short time. It provides you the flexibility to invite your team members to see how their tasks fit in the bigger picture of the project.
Meeting deadlines is crucial for the successful completion of a project, and Tom’s Planner helps you keep track of the due dates of all your tasks. You can also choose to see the schedules of your projects as an hourly, daily, weekly, or monthly view.
Pricing: The Unlimited plan is available for $19.95 per month.
6. TeamGantt

When it comes to project scheduling, Teamgantt is a great alternative because it allows users to easily and transparently manage their tasks. Tasks, timeframes, and team assignments are all included in TeamGantt.
What sets TeamGantt apart is their grasp of the project management mindset and philosophy, which they make sure to incorporate into their software. This tool provides a comprehensive view of each project, including its tasks, deadlines, and resources.
Pricing: The plan starts at $49 per month per manager.
7. OpenProject

OpenProject is a project management software that managers rely on to make the overall process of project management easier. Gantt charts are in handy when it comes to creating a project timeline and visualising project plans.
You can plan out your project’s tasks and observe the steps necessary to complete it successfully. The application also allows you to change the Gantt chart’s zoom level to see project progress on a daily to yearly basis.
Pricing: The community edition is free and the Basic plan is available for $7.25 per user per month (5 minimum users), Professional plan is available for $13.50 per user per month (25 minimum users) and Premium plan is available for $19.50 per user per month (100 minimum users).
8. ClickUp
ClickUp is a cloud-based project management and collaboration platform for businesses of all sizes and sectors. Communication and collaboration features, task assignments and statuses, alarms, and a task toolbar are all included. Users can assign comments and assignments to individuals or groups of individuals.
Users can mark comments and tasks as resolved or in progress, or they can construct their custom statuses.Projects can be sorted by the assignee or viewed via an Agile dashboard. In real-time, the activity stream displays tasks as they are produced and performed.
Pricing: Unlimited plan is available for $7 (best for small teams), Business plan is available for $12 (best for mid-sized teams).
How to pick the right Gantt chart software for your projects?
With so many tools claiming to be the ‘right Gantt chart software’, it can be hard to make the final choice. Before you select a tool in haste, make sure it allows you to do the following things:
- Share project information with others
- Collaborate in real-time
- Easy drag-and-drop for efficient scheduling
- Import, export, and integrable with third-party applications
Also, ask yourself some important questions before using Gantt chart software for your projects. Here are a few questions that might help you get started on the right foot.
- Why exactly do you need a Gantt chart? (to plan resources or to manage projects)
- Do you deal with several projects at once?
- How many of your tasks are recurrent?
- Do you need to collaborate with others?
Finding answers to these questions will help you get a better idea of what problems you want your Gantt chart tool to solve, thereby making it easier for you to spot the right tool among all the available options.
How to make a Gantt chart in ProofHub?
Creating a Gantt chart in ProofHub is very simple. Follow these steps to make a Gantt chart in ProofHub to streamline your project management:
- Plan and see the order in which you wish to execute your project’s tasks in a timeline view.
- Add task lists and tasks to the mix. Assign tasks to one or more persons, or subscribe to the complete task list.
- Mark critical dates on the project plan, such as desired completion dates or project meetings, by associating milestones with tasks.
- Establish task dependencies and update schedules as work and deadlines change.
- Track task progress as a percentage to see how much work has been completed and how much work remains.
- With private work lists on ProofHub’s online Gantt chart, only the designated people can see the task lists.
- Highlight the crucial path to examine the status of tasks that have a direct impact on the project’s start and end dates at a glance.
- To quickly adjust the dates or duration of tasks, simply drag & drop them onto the chart. Tasks should be rescheduled as work and deadlines change.
- To use for planning, scheduling, and resource management, export Gantt charts and keep a written record.
- All Gantt chart data may be found in one spot. Without having to jump across projects, you can track the progress of all tasks from all projects in one spot.
Conclusion
If you have read till the end, you must have now understood the importance of Gantt charts in managing projects. However, If you are still not sure how to create Gantt charts. ProofHub’s Gantt chart software can help you create project schedules, track progress made in tasks, set task dependencies, and manage resources effectively. Apart from these stellar features, it combines other project management functionalities as well.
FAQs
Can Gantt charts be used for agile project management?
Yes, Gantt charts can be adapted for agile methodologies as they incorporate iterative planning and flexible timelines.
In which stage are gantt charts first used?
Gantt charts are first used in the planning stage of a project.
What do gantt charts and pert charts have in common
Gantt charts and PERT charts are both project management tools used to visualize and plan project schedules.
